
Earthquake swarm near Bombay Beach, Salton Sea, southern California
Last updated: 2018-03-26 (84) 17:50:56 UTC
Quick Links
- Event distribution map
- View event data in Google Earth
- Event parameters
- Plot of events and magnitude over time
- 3–D interactive visualization
Translations
![]()
![]()
![]()
![]()
![]()
![]()
![]()
![]()
![]()
![]()
![]()
![]()
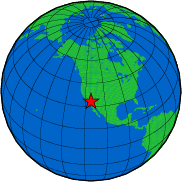
The Anza group at the University of California San Diego operates a broadband seismograph network consisting of 17 three component broadband seismograph stations centered near Anza, California (see map).
On Saturday March 21 2009 at 5:42 AM (PDT) we recorded the start of an earthquake swarm located near Bombay Beach on the east side of the Salton Sea. This swarm is currently continuing. We will periodically update this page.
View the most recent map of local events near San Diego or a slightly wider regional view of events recorded by ANZA, or a map of events recorded by ANZA from around the globe.
We also provide an interactive Google map displaying current seismicity in Southern California, with the capability to display the active fault zones in the region.
Event distribution map
We have currently recorded unique events from this earthquake swarm. This map shows mainshocks (> magnitude 3.0) as red stars. Other swarm events are orange stars. Anza network stations are yellow triangles. Larger stars indicate a larger magnitude. The red lines near the events represent the San Andreas (east side of the Salton Sea) and San Jacinto (west side of the Salton Sea) Fault Zones. Click on the fault line to display the fault name.
About this map
The event
map utilizes Google map technology and requires JavaScript to view. For
security reasons the station markers will disappear before zooming in
on their location.
View event data in Google Earth
 Right-click to download and view in Google Earth (258K)
You need to have Google Earth installed to view this file.
Event Parameters
[Table last updated 2009-04-09 13:42 PDT]
Currently there are events listed in the table. Click on the column title to dynamically sort the table contents by the values in that column.
The table is initially sorted on origin time (most recent at the top).
| Latitude | Longitude | Origin time (UTC) | Depth (km) | Magnitude |
|---|
Plot of events and magnitude over time
[Figure last updated 2009-04-09 08:00 PDT]
In the figure below the top panel shows the cumulative number of earthquakes as a function of time, the graph steepens when the number of earthquakes increases and flattens when the number of earthquakes taper off. The bottom panel shows the magnitude of the earthquakes as a function of time. As of March 30 the largest earthquake in this swarm was a magnitude 4.8 earthquake that occurred on Tuesday March 24th at 4:55 AM PST.

3–D interactive visualization
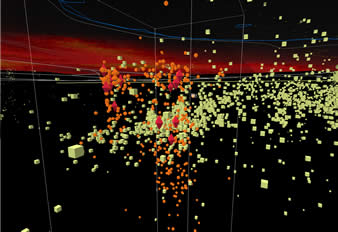
[Visualization last updated 2009-03-30 14:45 PDT]
The SIO Visualization Center has created a downloadable interactive 3–D visualization of the earthquake swarm. The visualization highlights the 12 largest earthquakes (red diamonds) in this swarm that range in magnitude from 3.0 to 4.8. Other earthquakes that are below magnitude 3.0 (orange spheres) are shown, as is the full set of all swarm earthquakes (purple crosshairs). For reference the location of ~419,522 earthquakes (yellow cubes) that occurred in southern California from 1981 to 2005 (data from LSH_1.12 catalog of Lin, Shearer and Hauksson, 2007, yellow box encompasses these data). Also included in this visualization are known California fault traces (brown lines), major roads (grey lines), and an outline of the state of California (white lines). Bathymetry and topography is shown for a portion of the region, and some of the major regional cities are labeled (green text).
Visit the IRIS website with additional links to seismic data for this event.
News Links
- USGS page for this event
- Los Angeles Times: "Salton Sea is swarming with earthquake data"
- Los Angeles Times: "At the Salton Sea, a warning sign of the Big One?"
Search the Internet
To search the internet for more information about this event, click on the button below:
![]()
Learn more about the Anza group (including who works
here, other networks, nuclear tests in China/India/Pakistan).
Learn
more about the ANZA network
(includes more station information, research, etc).