
Magnitude 6.0 quake near Parkfield, CA
Last updated: 2018-03-26 (84) 17:50:55 UTC
Quick Links
- Location map
- Detailed location map
- Initial source parameters
- 3 components [closest Anza station]
- Vertical components [all Anza stations]
- Waveforms recorded at Mt. Soledad
- Download 3-D interactive virtual model
![3 components [closest Anza station]](3comp_vert.gif)
![Vertical components [all Anza stations]](Anza_verts.gif)
Translations
![]()
![]()
![]()
![]()
![]()
![]()
![]()
![]()
![]()
The Anza group at the University of California San Diego operates a broadband seismograph network consisting of 17 three component broadband seismograph stations centered near Anza, California (see map).
On Tuesday, September 28th, 2004 at 10:15 AM (PDT) we recorded a quake (preliminary ML 6.0) located near Parkfield, CA. This is the anticipated Parkfield earthquake on the San Andreas fault. It ruptured approximately the same segment of the fault that broke in 1966.
If you felt the quake, the USGS would like to know. Please add to the USGS "Did you feel it?" page.
View the most recent map of local events near San Diego or a slightly wider regional view of events recoded by ANZA, or a map of events recoded by ANZA from around the globe.
Initial source parameters for the recent event are shown below. The epicentral distance (distance separating the epicenter and the closest station in the recording network, SMER) for Anza is 393.3 km (3.54 degrees ).
This map shows the mainshock (red star) and any associated aftershocks (orange stars). Anza network stations are yellow triangles.
Event Map
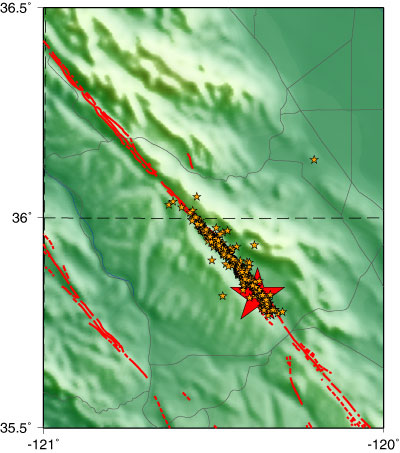
Detailed Location Map
The map below is a 1° square map centered (36°N, -120.5°E) close to the epicenter of this event. The over 600 aftershocks have been plotted at a smaller size in order to show how well they define the San Andreas fault (red line that is oriented NW-SE).
Event Parameters
As of 2004/10/01 10:34 AM (PDT) there have been over 600 aftershocks related to this event. The table below lists the main shock (in red) and aftershocks (in orange) greater than magnitude 3.0.
| Latitude | Longitude | Origin time (UTC) | Origin time (PDT) | ML | Depth (km) | Author |
|---|---|---|---|---|---|---|
| 35.815 | -120.374 | 2004/09/28 (272) 17:15:24 | 2004/09/28 (272) 10:15:24 | 6.0 | 7.9 | USGS |
| 35.855 | -120.411 | 2004/09/28 (272) 17:19:06 | 2004/09/28 (272) 10:19:06 | 5.0 | 8.6 | USGS |
| 35.840 | -120.388 | 2004/09/28 (272) 17:22:18 | 2004/09/28 (272) 10:22:18 | 4.1 | 5.6 | USGS |
| 35.806 | -120.349 | 2004/09/28 (272) 17:24:15 | 2004/09/28 (272) 10:24:15 | 4.7 | 6.7 | USGS |
| 35.852 | -120.401 | 2004/09/28 (272) 17:29:15 | 2004/09/28 (272) 10:29:15 | 3.4 | 5.3 | USGS |
| 35.836 | -120.380 | 2004/09/28 (272) 17:29:22 | 2004/09/28 (272) 10:29:22 | 3.3 | 9.0 | USGS |
| 35.829 | -120.369 | 2004/09/28 (272) 17:29:41 | 2004/09/28 (272) 10:29:41 | 3.2 | 9.4 | USGS |
| 35.817 | -120.359 | 2004/09/28 (272) 17:33:55 | 2004/09/28 (272) 10:33:55 | 3.7 | 7.1 | USGS |
| 35.947 | -120.489 | 2004/09/28 (272) 17:35:17 | 2004/09/28 (272) 10:35:17 | 3.6 | 10.2 | USGS |
| 35.830 | -120.379 | 2004/09/28 (272) 19:23:39 | 2004/09/28 (272) 12:23:39 | 3.1 | 6.6 | USGS |
| 35.839 | -120.387 | 2004/09/28 (272) 19:31:27 | 2004/09/28 (272) 12:31:27 | 4.0 | 9.3 | USGS |
| 35.893 | -120.446 | 2004/09/29 (273) 01:53:35 | 2004/09/28 (272) 18:53:27 | 3.4 | 5.8 | USGS |
| 36.644 | -120.880 | 2004/09/29 (273) 09:04:07 | 2004/09/29 (273) 02:04:07 | 3.2 | 0.0 | USGS |
| 36.139 | -120.207 | 2004/09/29 (273) 16:11:51 | 2004/09/29 (273) 09:11:51 | 3.1 | 7.8 | USGS |
| 35.953 | -120.502 | 2004/09/29 (273) 17:10:04 | 2004/09/29 (273) 10:10:04 | 5.0 | 11.5 | USGS |
| 35.952 | -120.492 | 2004/09/29 (273) 17:12:06 | 2004/09/29 (273) 10:12:06 | 4.5 | 10.2 | USGS |
| 35.953 | -120.506 | 2004/09/30 (274) 05:02:27 | 2004/09/29 (273) 22:02:27 | 3.5 | 9.7 | USGS |
| 35.984 | -120.550 | 2004/09/30 (274) 18:54:28 | 2004/09/30 (274) 11:54:28 | 5.0 | 10.1 | USGS |
* The location and magnitude determined for this event are preliminary and are subject to change upon further review of seismic data.
You may also view a plot showing
Of local interest:
We operate a broadband station on Mt. Soledad. At 10:16 (PDT) station SOL recorded the P wave from this event. Here is a view of that event as picked by our analyst. A red P indicates a P wave arrival, a red S indicates an S wave arrival.
View a larger image showing the waveforms recorded at Mt. Soledad.
Visit the IRIS website with additional links to seismic data for this event.
Virtual 3-D Model
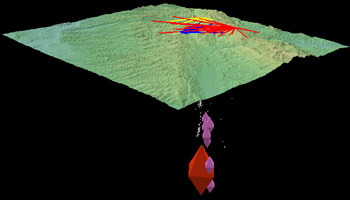
Screen shot of the virtual 3-D model
You may download an interactive 3-D model by right-clicking (Windows) or CTRL-clicking (Mac) the links below and choosing "Download file to disk". The file has been compressed to ~8MB with gzip and must be expanded before use. Alternatively you can download the uncompressed scene file (17MB). To view the virtual model, you need to download iView 3D - a free viewer available from IVS for Windows, Mac, Linux, Sun and SGI platforms. Click here to download the viewer.
The model consists of an outline of the state of California (light blue lines) and major highways (purple lines). The region of Parkfield has high-resolution topography. The model and its component parts have been accurately geo-referenced. The earthquake hypocenter is plotted as a red diamond and the first 10 aftershocks above magnitude 3 are plotted as pink diamonds. The Red/Blue/Yellow lines depict the station telemetry paths from the PASO experiment. Seismicity recorded by the PASO experiment are plotted as small white spheres (they clearly define the San Andreas Fault Zone) and additional seismicity post 1983 (from the PDE catalog) are plotted as small white points and include the off fault seismicity from the 1983 magnitude 6.4 Coalinga earthquake.
Once the file has loaded into iView3D, navigation is accomplished by using the mouse. Click the left mouse button and drag left or right to rotate about the vertical axis. Click the left mouse button and drag up or down to rotate about the horizontal axis. Translations and scaling are both accomplished with either the middle or right mouse buttons in a two-step process.
News Links
- [CNN] Strong quake shakes central California
- [USAToday] Strong earthquake strikes central California
- [San Diego Union Tribune] Earthquake shakes Central California
Search the Internet
To search the internet for more information about this event, click on the button below:
![]()
Learn more about the Anza group (including who works
here, other networks, nuclear tests in China/India/Pakistan).
Learn
more about the ANZA network
(includes more station information, research, etc).