
Magnitude Mw 7.2 (ml 6.9) quake near Guadalupe Victoria, Baja California Norte, Mexico
Last updated: 2018-03-26 (84) 17:50:55 UTC
Quick Links
- Location map
- Initial source parameters
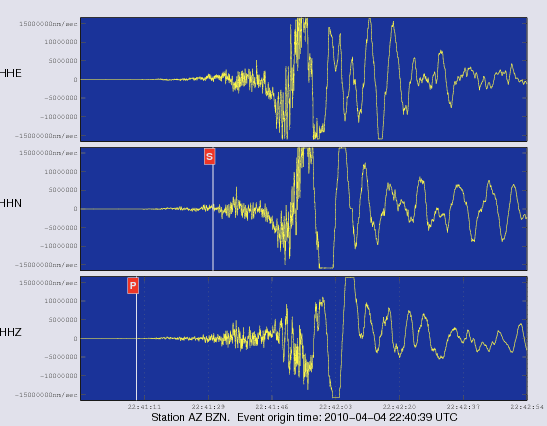
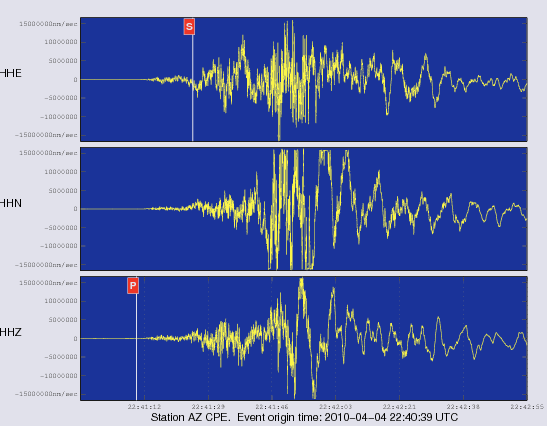
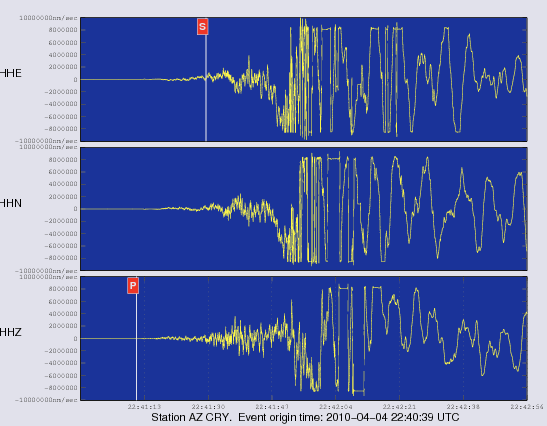
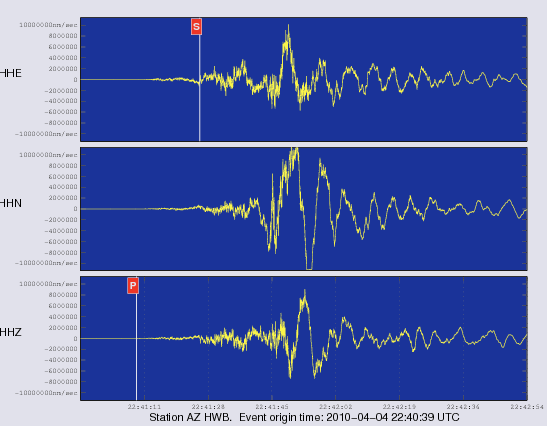
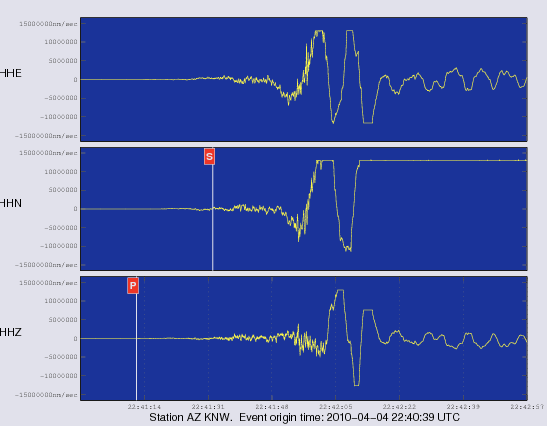
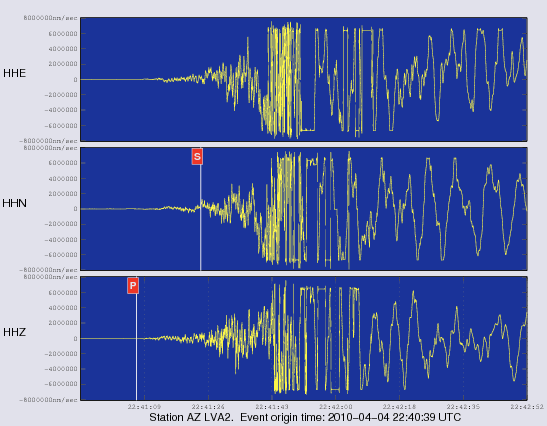
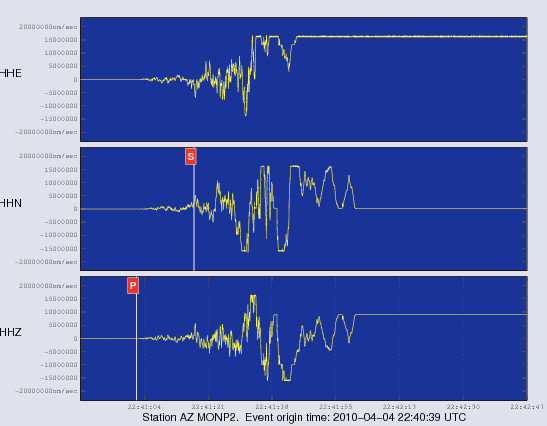
- 3 components [closest Anza station]
- Vertical components [all Anza stations]
- Waveforms recorded at Mt. Soledad
- Interactive Google Earth interface
- Download a Google Earth KMZ file of this event
![3 components [closest Anza station]](3comp_vert.gif)
![Vertical components [all Anza stations]](Anza_verts.gif)
Translations
![]()
![]()
![]()
![]()
![]()
![]()
![]()
![]()
![]()
![]()
![]()
![]()
Social Bookmarking
![]()
The Anza group at the University of California San Diego operates a broadband seismograph network consisting of 17 three component broadband seismograph stations centered near Anza, California (see map).
On Sunday April 4 2010 at 3:40 PM (PDT) we recorded an earthquake (preliminary Mw 7.2, ml 6.9) located near Guadalupe Victoria, Baja California Norte, Mexico. Many network stations, including Monument Peak (MONP2) - the closest station to the event - have their waveforms clipped due to the large magnitude of this event. Click here to learn why different magnitudes and different magnitude scales are used for earthquake solution calculations. Typically, for larger magnitude events, the Mw scale is the better magnitude scale to use.
If you have felt this quake, the USGS would like to know. Please add your comments to the USGS page "Did you feel it?".
View the most recent map of local events near San Diego or a slightly wider regional view of events recorded by ANZA, or a map of events recorded by ANZA from around the globe.
Initial source parameters for this tremor are indicated below. The epicentral distance (i.e. the distance separating the epicenter and the closest station in the recording network) for Anza is 141 km (1.27 degrees).
This map shows the mainshock as a red star. Other epicentral solutions are orange stars. Anza network stations are yellow triangles. Blue lines are major rivers. Thin black lines are state boundaries and thick black lines are national boundaries.
Event Map
Event Parameters
The first solution listed is provided by Caltech. The second solution listed is provided by the Anza network.
| Latitude | Longitude | Origin time (UTC) | Origin time (PDT) | Depth (km) | ml | Mw | Algorithm | Author |
|---|---|---|---|---|---|---|---|---|
| 32.2950 | -115.2740 | 04/04/10 (094) 22:40.42 | 04/04/10 (094) 3:40 PM | 6.0 | 6.9 | 7.2 | – | CICESE |
| 32.5027 | -115.5575 | 04/04/10 (094) 22:43.75 | 04/04/10 (094) 3:43 PM | 6.0 | 6.9 | 7.2 | locsat:iasp91 | UCSD:rt |
* The location and magnitude determined for this event are preliminary and are subject to change upon further review of seismic data.
You may also view a plot showing
- the 3 components recorded by the closest Anza station
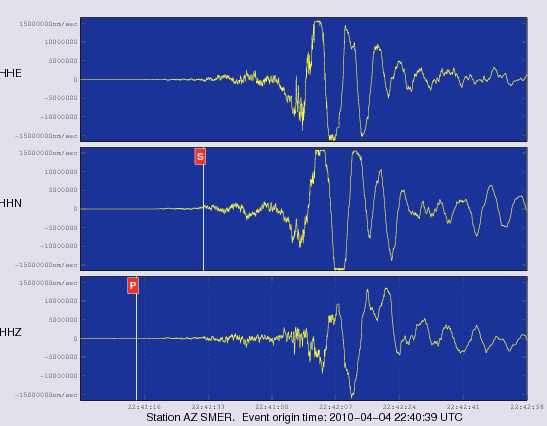
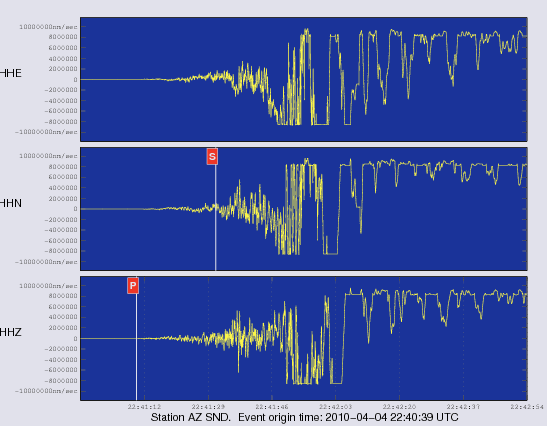
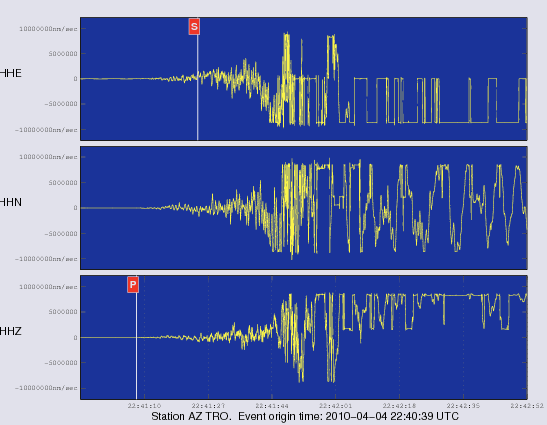
- the vertical components for all Anza stations
- View waveforms from Anza stations:
- BZN: low resolution PNG file | high resolution EPS file
- CPE: low resolution PNG file | high resolution EPS file
- CRY: low resolution PNG file | high resolution EPS file
- FRD: low resolution PNG file | high resolution EPS file
- HWB: low resolution PNG file | high resolution EPS file
- KNW: low resolution PNG file | high resolution EPS file
- LVA2: low resolution PNG file | high resolution EPS file
- MONP2: low resolution PNG file | high resolution EPS file
- PFO: low resolution PNG file | high resolution EPS file
- RDM: low resolution PNG file | high resolution EPS file
- SMER: low resolution PNG file | high resolution EPS file
- SND: low resolution PNG file | high resolution EPS file
- SOL: low resolution PNG file | high resolution EPS file
- TRO: low resolution PNG file | high resolution EPS file
- WMC: low resolution PNG file | high resolution EPS file
Interactive Google Earth mapping interface
Use the interactive map below to explore the main shock and associated aftershocks in the region. Click here to learn how to use the Google Earth browser plugin.
Download Google Earth file
Click to download a Google Earth KMZ file of this event
Of local interest
We operate a broadband station on Mt. Soledad. At 15:41 (PDT) station SOL recorded the P wave from this event. Here is a view of that event as picked by our analyst. A red P indicates a P wave arrival, a red S indicates an S wave arrival.
View a larger image showing the waveforms recorded at Mt. Soledad.
Visit the IRIS website with additional links to seismic data for this event.
News Links
Search the Internet
To search the internet for more information about this event, click on the button below:
![]()
Share this page
If you find this page useful, please share it:
![]()
Learn more about the Anza group (including who works
here, other networks, nuclear tests in China/India/Pakistan).
Learn
more about the ANZA network
(includes more station information, research, etc).