
Magnitude 5.1 quake near Anza, California
Last updated: 2018-03-26 17:50:59 UTC
Translations
![]()
![]()
![]()
![]()
![]()
![]()
![]()
![]()
![]()
The Anza group at the University of California San Diego operates a broadband seismograph network consisting of 13 (+ 2) three component broadband seismograph stations centered near Anza Californa (see map).
On Tuesday, October 30th, 2001 at 23:56:15 (PST) we recorded a quake (preliminary ml 5.1) located near the town of Anza, CA. This quake has been felt throughout the San Diego region. This page will be updated as more information becomes available. Numerous small aftershocks have been recorded.
If felt the quake, USGS would like to know. Add to the USGS "Did you feel it?" page.
View the most recent map of local events near San Diego or a map of events recoded by ANZA from around the globe.Initial source parameters for the recent event and aftershocks are shown below. The epicentral distance (distance separating the epicenter and the recording network) for ANZA is 0.064 degrees (~7 km).
This map shows the mainshock and the many small aftershocks. ANZA network stations are yellow triangles. Faults are plotted in red and some roads are plotted in grey.
Event Map
Event Parameters
| Latitude | Longitude | Origin time | Depth | ml | Author |
|---|---|---|---|---|---|
| 33.5187 | -116.5022 | 10/31/2001 (304) 7:56:15:343 | 18.764 | 4.82* | UCSD:eakins |
| 33.5083 | -116.5143 | 10/31/2001 (304) 7:56:16:30 | 15.220 | 5.1* | CIT |
*note that the location and magnitude determined for this event is preliminary and is subject to change upon further review of seismic data.
This plot shows the waveform recordings for the vertical, north/south, and east/west channels of the closest Anza station.
You may also view
Note that some stations such as BZN and PFO were clipped.
Of local interest:
We operate a broadband station on Mt. Soledad. This earthquake was located 0.907 degrees (~100km/61 mi) from our Mt. Soledad station. At 23:56:33, ~17 seconds after the event occurred, station SOL recorded the P wave from this event.
Here is a view of that event as picked by our analyst. The P indicates a P wave arrival, the S indicates an S wave arrival. The solid vertical white lines indicate the predicted arrival times based on a general velocity model.

View a larger image showing the waveforms recorded at Mt. Soledad.
The plot below shows the vertical movement recorded by each station in the Anza network. At the left hand side of the figure you see relative quiet approximately 25 minutes prior to the main shock. After the earthquake you see many vertical yellow lines with associated red brackets which indicate the hundreds of aftershocks that we have recorded. The entire display shows the first 5 hours after the earthquake. Click here for a bigger image.

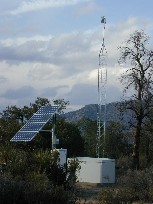
The University of California operates the Pinon Flat Observatory which is located in the Anza area. In addition to permanent seismometer installations, this research site has many other deployed instruments. The observatory is now the site of a permanent 8-element infrasound array. The array is one of the first in a global infrasound network that is currently being constructed as part of the International Monitoring System. The system is being created to monitor nuclear tests and other man-made and natural phenomena. The array is designed to sense acoustic signals in the atmosphere at frequencies ranging from 0.02 to 10 Hz. The sensors also respond to ground motion. The figures below show a map of the array, recordings of the Oct 30 earthquake made by the microbarometers compared to seismic station PFO, and pictures of one of element "L3" in the array. For more information, please contact Dr. Michael Hedlin.
The array began recording in March, 2001 and now delivers data in real-time to our lab in La Jolla and to Vienna. Two sites L3 and L4 are radio-telemetered, the others are on fibre.
The BDF channels are filtered (50 s to 27 Hz) infrasound filtered further by the aa filter back to 9 Hz. The data are sampled at 20 Hz. The L lements are long-period (attached to large scale noise reducing filters) the H elements are high-frequency elements. We refer to the false signals on the microbarometers due to ground shaking as "microphonics".

Two pictures of one site (L3):
 |
 |
Learn more about the Anza group (including who works here, other networks, nuclear tests in India and Pakistan).
Learn more about the ANZA network (includes more station information, research, etc).
URL: http://eqinfo.ucsd.edu/special_events/2001/304/a/index.php [Last updated: 2018-03-26 17:50:59 UTC]