
Magnitude 9.1 quake off the west coast of Northern Sumatra
Last updated: 2018-03-26 17:50:55 UTC

Quick Links
- Location map
- Initial source parameters
- 3 components [closest Anza station]
- Vertical components [all Anza stations]
- Waveforms recorded at Mt. Soledad
- Virtual 3-D Model
![3 components [closest Anza station]](3comp_vert.JPG)
![Vertical components [all Anza stations]](Anza_verts.gif)
Translations
![]()
![]()
![]()
![]()
![]()
![]()
![]()
![]()
![]()
The Anza group at the University of California San Diego operates a broadband seismograph network consisting of 17 three component broadband seismograph stations centered near Anza, California (see map).
The IDA group at the University of California San Diego operates the Global Seismic Network (GSN) which has 40 three component broadband seismograph stations, several of which are located close to the epicenter for this event. The information recorded by their instruments show the waveform arrivals very clearly.
On Saturday, December 25th, 2004 at 4:58:50 PM (PST) we recorded a quake (preliminary Mw 9.1) located off the west coast of Northern Sumatra.
View a significant (preliminary Mw 6.9) aftershock which was recorded on Friday, May 13, 2005 near El Centro.
View the most recent map of local events near San Diego or a slightly wider regional view of events recoded by ANZA, or a map of events recoded by ANZA from around the globe.
Initial source parameters for the recent event are shown below. The epicentral distance (distance separating the epicenter and the closest station in the recording network) for Anza is 14698 km (132.08 degrees).
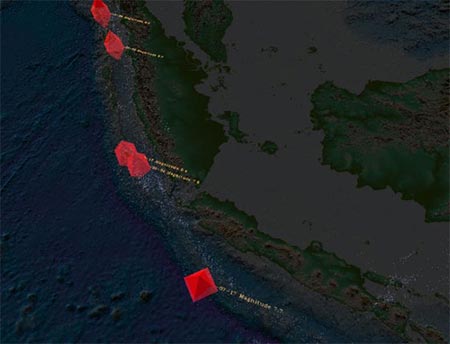
This map shows the mainshock (red star) and any associated aftershocks (orange stars). Anza network stations are yellow triangles.
Event Map

Event Parameters
| Latitude | Longitude | Origin time (UTC) | Origin time (PST) | Depth (km) | Mw | Author |
|---|---|---|---|---|---|---|
| 3.298 | 95.779 | 12/26/04 00:58:50 | 12/25/04 (360) 4:58:50 PM | 10 | 9.1 | USGS |
* The location and magnitude determined for this event are preliminary and are subject to change upon further review of seismic data.
You may also view a plot showing
Of local interest:
We operate a broadband station on Mt. Soledad. At 4:58 PM station SOL recorded the P wave from this event. Here is a view of that event as picked by our analyst. A red P indicates a P wave arrival, a red S indicates an S wave arrival.

View a larger image showing the waveforms recorded at Mt. Soledad.
Visit the IDA website to observe the waveforms recorded by stations in the Global Seismic Network (GSN).
Virtual 3-D Model
To download and view this interactive 3-D model, please visit the SIO Viz Center web page.
Visit the IRIS website with additional links to seismic data for this event.
External Links
Search the Internet
To search the internet for more information about this event, click on the button below:
![]()
Learn more about the Anza group (including who works here, other networks, nuclear tests in China/India/Pakistan).
Learn more about the ANZA network (includes more station information, research, etc).
URL: http://eqinfo.ucsd.edu/special_events/2004/361/a/index.php [Last updated: 2018-03-26 17:50:55 UTC]