
Magnitude 4.5 quake near Ocotillo, California
Last updated: 2018-03-26 (84) 17:50:59 UTC

Quick Links
- Location map
- Initial source parameters
- 3 components [closest Anza station]
- Vertical components [all Anza stations]
- 3-D Visualization
- Waveforms recorded at Mt. Soledad
![3 components [closest Anza station]](3comp_vert.gif)
![Vertical components [all Anza stations]](Anza_verts.gif)
Translations
![]()
![]()
![]()
![]()
![]()
![]()
![]()
![]()
![]()
The Anza group at the University of California San Diego operates a broadband seismograph network consisting of 17 three component broadband seismograph stations centered near Anza, California (see map).
On Friday November 3 2006 at 7:56 AM (PST) we recorded an earthquake (preliminary ml 4.5) located near Ocotillo.
If you have felt this quake, the USGS would like to know. Please add your comments to the USGS page "Did you feel it?".
View the most recent map of local events near San Diego or a slightly wider regional view of events recorded by ANZA, or a map of events recorded by ANZA from around the globe.
Initial source parameters for this tremor are indicated below. The epicentral distance (i.e. the distance separating the epicenter and the closest station in the recording network) for Anza is 40 km (0.36 degrees).
This map shows the mainshock as a red star. Associated aftershocks are orange stars. Anza network stations are yellow triangles. Gray lines are major roads and red lines are faults.
Event Map
Event Parameters
The table row in red is all the event parameters for the main earthquake. Orange table rows are event parameters for subsequent aftershocks.
| Latitude | Longitude | Origin time (UTC) | Origin time (PST) | Depth (km) | ml | Author |
|---|---|---|---|---|---|---|
| 32.6968 | -116.0623 | 11/03/06 (307) 15:56.43 | 11/03/06 (307) 7:56 AM | 8.2 | 4.5 | cit_10215753 |
| 32.697 | -116.061 | 11/03/06 (307) 16:08.21 | 11/03/06 (307) 8:08 AM | 5.9 | 2.0 | cit_10215761 |
| 32.697 | -116.060 | 11/03/06 (307) 16:12.13 | 11/03/06 (307) 8:12 AM | 5.8 | 3.6 | cit_10215765 |
| 32.662 | -116.055 | 11/03/06 (307) 16:13.55 | 11/03/06 (307) 8:14 AM | 12.2 | 2.7 | cit_10215769 |
| 32.698 | -116.059 | 11/03/06 (307) 16:54.23 | 11/03/06 (307) 8:54 AM | 8.3 | 1.5 | cit_10215777 |
| 32.673 | -116.017 | 11/03/06 (307) 17:41.10 | 11/03/06 (307) 9:41 AM | 17.6 | 1.5 | cit_10215789 |
| 32.694 | -116.050 | 11/03/06 (307) 17:47.18 | 11/03/06 (307) 9:47 AM | 8.1 | 1.7 | cit_10215793 |
| 32.702 | -116.055 | 11/03/06 (307) 18:16.37 | 11/03/06 (307) 10:16 AM | 10.1 | 1.5 | cit_10215805 |
| 32.694 | -116.065 | 11/03/06 (307) 18:16.37 | 11/03/06 (307) 10:16 AM | 4.0 | 2.3 | cit_10215809 |
* The location and magnitude determined for this event are preliminary and are subject to change upon further review of seismic data.
You may also view a plot showing
3-D Visualization
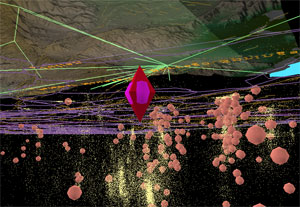
Screenshot of the 3-D visual object for this event
Staff at the SIO Visualization Center have made a 3-D visual object of this event. Viewing the object requires downloading and installing a third-party freeware plugin. This visualization includes: (1) The mainshock event (red diamond) and the largest aftershock (pink sphere; magnitude 3.6); (2) Earthquakes in the ANZA network catalog that are over magnitude 4 (salmon spheres); and (3) Historical southern California seismicity (yellow points). Also included in this visualization is topography/bathemetry of the region, town names and telemetry paths for the ANZA broadband seismic network (green lines), known surface faults (brown lines) and major roadways (purple lines).
For more information, visit their webpage for this event:
Of local interest:
We operate a broadband station on Mt. Soledad. At 07:56 (PST) station SOL recorded the P wave from this event. Here is a view of that event as picked by our analyst. A red P indicates a P wave arrival, a red S indicates an S wave arrival.
View a larger image showing the waveforms recorded at Mt. Soledad.
Visit the IRIS website with additional links to seismic data for this event.
News Links
Search the Internet
To search the internet for more information about this event, click on the button below:
![]()
Learn more about the Anza group (including who works
here, other networks, nuclear tests in China/India/Pakistan).
Learn
more about the ANZA network
(includes more station information, research, etc).