
Comparison of the June 12th 2005 Mw 5.2 and October 31 2001 Mw 5.1 Anza, California earthquakes
Last updated: 2018-03-26 (84) 17:50:56 UTC

Quick Links
- Maps
- Historical seismicity in Southern California
- Event Map: Southern California regional view
- Event map: local Anza view
- Station distance & peak accelerations from June 12, 2005 Mw 5.2 event
- Multimedia
- Education and Outreach
- Publications and Abstracts
- Links
Translations
![]()
![]()
![]()
![]()
![]()
![]()
![]()
![]()
![]()
On Sunday, June 12, 2005 at 8:41 AM (PDT) we recorded an earthquake (Mw 5.2) located near Anza, Southern California.
This web page gathers together diverse sources of information about the event, comparing and contrasting this event with the October 31st, 2001 (Mw 5.1) earthquake that occurred just south–east of the more recent event.
Maps
Map Legend

Historical seismicity in Southern California
Orange dots represent earthquakes recorded in the region from 1982 to 2003.

Event Map: Southern California regional view

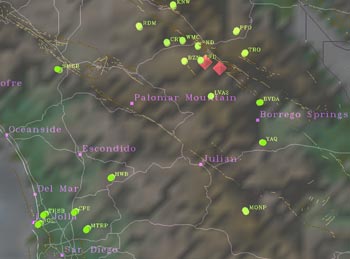
Event map: local Anza view
Clicking the links below will replace the local Anza view map with the selected map. To return to the original map, click the ”View event map“ hyperlink.
- View event map
- View town & highway map
- View historical seismicity map (1982–2003)
- View aftershock map for 2005 event
- View aftershock map for 2001 event
Map Legend

Note: If the station is colored orange, you can click the station to show the waveform recorded from the June 12th, 2005 Mw 5.2 event.


Station distance & peak accelerations from June 12, 2005 Mw 5.2 event
| Station | Distance (km) | seaz | esaz | peak-acc-HNZ (mg) | peak-acc-HNN (mg) | peak-acc-HNE (mg) | Acc. waveform image? |
|---|---|---|---|---|---|---|---|
| SND | 3.774 | 133.68 | 313.69 | -55.216 | 123.507 | -85.433 | yes |
| FRD | 4.107 | 25.20 | 205.21 | 52.186 | 44.260 | 23.683 | yes |
| BZN | 8.769 | 62.20 | 242.24 | -120.652 | 245.522 | 233.103 | yes |
| WMC | 9.879 | 120.71 | 300.76 | 140.599 | -230.531 | 294.693 | yes |
| TRO | 14.652 | 272.18 | 92.09 | -130.943 | -166.190 | 284.743 | yes |
| PFO | 14.763 | 231.09 | 51.02 | 124.814 | -495.668 | -244.835 | yes |
| CRY | 14.874 | 106.08 | 286.16 | -74.818 | -198.006 | 99.448 | yes |
| LVA2 | 19.758 | 354.14 | 174.13 | -25.344 | -25.455 | -26.200 | yes |
| KNW | 23.865 | 150.00 | 330.07 | 132.422 | 94.021 | 90.629 | yes |
| RDM | 26.973 | 114.70 | 294.84 | 99.442 | 203.394 | 158.953 | yes |
| BVDA2 | 30.192 | 318.05 | 137.93 | — | — | — | no |
| YAQ | 45.399 | 332.15 | 152.03 | 18.044 | 18.370 | 23.872 | yes |
| SMER | 54.945 | 81.64 | 261.96 | — | — | — | no |
| HWB | 65.823 | 31.97 | 212.18 | -14.726 | — | 21.274 | no |
| MONP | 72.15 | 348.10 | 168.01 | — | — | — | no |
| MTRP | 90.132 | 29.11 | 209.37 | — | — | — | no |
| SOL | 98.124 | 38.81 | 219.17 | — | — | — | no |
| CSLB | 144.08 | 100.73 | 281.58 | — | — | — | no |
| SCI2 | 189.48 | 68.43 | 249.47 | — | — | — | no |
| Station | Distance (km) | seaz | esaz | peak-acc-HNZ (mg) | peak-acc-HNN (mg) | peak-acc-HNE (mg) | Acc. waveform image? |
Definitions
Multimedia
Movies

- Map and timeline of aftershocks from the October 31st, 2001 Mw 5.1 event (all aftershocks) [12MB]
- Map and timeline of aftershocks from the October 31st, 2001 Mw 5.1 event (aftershocks > 2) [11MB]

- Map and timeline of aftershocks from the June 12th, 2005 Mw 5.2 event (all aftershocks) [13MB]
- Map and timeline of aftershocks from the June 12th, 2005 Mw 5.2 event (aftershocks > 2) [10MB]
3-D interactive models
Screen shot of the virtual 3-D model
You may download an interactive 3-D model by right-clicking (Windows) or CTRL-clicking (Mac) the links below and choosing “Download file to disk”. The file has been compressed to 1.7MB with gzip and must be expanded before use. Alternatively you can download the uncompressed scene file (5.6MB). To view the virtual model, you need to download iView 3D - a free viewer available from IVS for Windows, Mac, Linux, Sun and SGI platforms. Click here to download the viewer.
The model consists of an outline of the state of California (white lines), fault systems (brown lines), major highways (purple lines), and high–resolution topography in Southern California. The model and its component parts have been accurately geo-referenced. The Mw 5.2 earthquake of June 12 2005 hypocenter and the Mw 5.1 earthquake of October 31 2001 hypocenter have been plotted as red diamonds. Historical seismicity post 1983 (from the ANZA & NCEDC catalogs) are plotted as small yellow points. Major towns in the region are also plotted.
Once the file has loaded into iView3D, navigation is accomplished by using the mouse. Click the left mouse button and drag left or right to rotate about the vertical axis. Click the left mouse button and drag up or down to rotate about the horizontal axis. Translations and scaling are both accomplished with either the middle or right mouse buttons in a two-step process.
Note to Apple Safari Users
The “Download file to disk” CTRL-click option may download the scene file as a text file (saving the file as a .txt format). If this occurs, or you encounter problems opening the scene file, please try downloading the scene file again, but using a different browser such as Mozilla's Firefox or Camino, or Opera.
Education & Outreach Activities
- Earthquake, part I: SIO Comm and the Scripps Viz Center were a hubbub of proactive media activity on Sunday (6/12) following the 5.6 Anza earthquake. SIO Comm set a plan for an afternoon media opportunity and alerted all TV stations. TV news coverage included: KUSI, NBC 7/39, KSWB, and Fox 6.
- Earthquake, part II: Tuesday's (6/14) northern California 7.2 earthquake and subsequent tsunami warming prompted media calls from Fox-6, KGTV-1, and KSWB-5 .
- Earthquake, part III: Thursday's (6/16) 5.5 earthquake near San Bernardino prompted immediate inquiries for seismologists and the Viz Center by KUSI 9/51, FOX-6, and KGTV-10. Mario then alerted KFMB-8, NBC 7/39, and KSWB-5. All attended an afternoon media briefing except for NBC 7/39.
- Bruce Lieberman of the Union-Tribune also interviewed Debi Kilb at the media briefing. On Friday, NBC 7/39's Artie Ojeda interviewed Kilb for a roundup of the earthquake activity. Scripps geophysics student Jose Otero appeared live on FOX-6's Friday morning news program and is slated to appear Sunday July 3rd, 2005 on NBC 7/39's morning program.
Publications and Abstracts using data from the October 31st, 2001 Mw 5.1 event
Peer–reviewed publications
- Kilb, D., R.L. Newman, F.L. Vernon, J.A. Eakins, L. Ziegler, J. Bowen, J. Otero, "Education and Outreach Based on data from the ANZA Seismic Network in Southern California" Seis. Res. Lett. V. 74, no. 5, p. 522-528, 2003.
- Kilb, D., C.S. Keen, R.L. Newman, G.M. Kent, D.T.Sandwell, F.L. Vernon, C.L. Johnson, J.A. Orcutt, "The Visualization Center at Scripps Institution of Oceanography: Education & Outreach" Seis. Res. Lett. V. 74, no. 5, p. 641-648, 2003.
- Pavlis, G. P., F Vernon, D. Harvey, D. Quinlan, "The generalized earthquake-location (GENLOC) package: an earthquake-location library." Computers & Geosciences, 30, 2004.
- Prieto, G.A., P.M. Shearer, F.L. Vernon, and D. Kilb, "Earthquake source scaling and self-similarity estimation from stacking P and S spectra", JGR, V. 109, B08310, doi:10.1029/2004JB003084, 2004.
- Lewis, M. A., Z. Peng, Y. Ben-Zion, F. L. Vernon, "Shallow seismic trapping structure in the San Jacinto fault zone near Anza, California." Geophys. J. Int., 2005.
Abstracts
- Kilb, D., J. Hardebeck, A. Hindley, P. Shearer, J. Eakins, and F. Vernon. Waveform and Focal Mechanism Heterogeneity in Aftershocks of the 10/31/2001 M5.1 Anza, California, Earthquake: Why and Where. Fall SCEC Meeting, 2002.
- Kilb, D., V. Martynov, J. Bowen, F. Vernon, J. Eakins. Estimating the similarity of earthquake focal mechanisms from waveform cross-correlation in regions of minimal local azimuthal station coverage, Fall Meeting Supplement, Abstract S71C-1117, 2002.
- Vernon, F, D. Kilb, J. Eakins, J. Otero, S.W. Roecker, C.H. Thurber. Visualization of Real-time Seismic Field Experiments, Fall Meeting Supplement, Abstract U52A-08 (invited), 2002.
- Kilb, D., G. Biasi, J. Brune, J Anderson, F.L. Vernon. What controls the characteristics of seismic spectrum: An examination of 100s of spectra from southern California earthquakes recorded by the ANZA seismic network. Fall, SCEC Meeting, 2003.
- Peng Z., F.Vernon, Y.Ben-Zion, D. Kilb, G. Biasi. Static and dynamic source scaling relations from earthquakes recorded by the ANZA seismic network and a temporary seismic network in the Karadere-duzce branch fo the north Anatolian fault. Fall, SCEC Meeting, 2003.
- Prieto, G.A, P. Shearer, D. Kilb, F.L. Vernon. Earthquake source scaling and self-similarity estimation by stacking P and S spectra, Fall Meeting Supplement, Abstract S41G-04, 2003
- Peng Z., F.L. Vernon, Y. Ben-Zion, D. Kilb, G. Biasi. Self-consistent Derivation of Earthquake Source Properties: Method and Examples from Seismic Networks at ANZA, CA, and the Karadere-Duzce faults, Turkey Fall Meeting Supplement, Abstract S52H-03, 2003.
- Biasi G.P., J.G.Anderson, J.N. Brune, K.D. Smith, D. Kilb. Kappa at Permanent Stations of the Southern Great Basin Digital Seismic Network. Fall Meeting Supplement, Abstract S11D-0318, 2003.
- Kilb, D., G. Biasi, J. Brune, J Anderson, F.L. Vernon. Quantifying properties of seismic spectra: an examination of 100's of spectra from southern California earthquakes recorded by the ANZA seismic network. Fall Meeting Supplement, Abstract S42C-0173, 2003.
- Nayak, A.M., K. Lindquist, D. Kilb, R. Newman, F. Vernon, J. Leigh, A. Johnson, L. Renambot. Using 3D Glyph Visualization to Explore Real-time Seismic Data on Immersive and High-resolution Display Systems. Fall Meeting Supplement, Abstract ED32C-1208, 2003.
- Prieto, G., Shearer, P. Kilb, D., and F. Vernon, Source Scaling Self-Similarity Estimation by Stacking P and S Spectra, SSA abstract 04-121, 2004.
- Kilb, D., Martynov, V., and F. Vernon, Examination of the Temporal Lag Between the 31 October 2001 Anza, California, M 5.1 Mainshock and the First Aftershocks Recorded by the Anza Seismic Network. SSA abstract 04-149, G6, 2004.
- Kilb, D., Development of 3-D Interactive Visual Object Using the Scripps Institution of Oceanography's Visualization Center, Abstract for select meeting Teaching Geoscience with Visualizations: Using Images, Animations, and Models Effectively, 2004.
- Newman, R.L., Kilb, D., & Kent, G.M., San Diegos Fault Zones, On Board: A newsletter from the Birch Aquairum at Scripps, Fall 2004.
- Kilb, D., Bowen, J., Eakins, J., Lindquist, K., Martynov, V., Newman, R. L., Otero, J., Prieto, G., Vernon, F.L., Ziegler, L., Generation of 3D interactive visualization tools pertaining to significant earthquakes in southern California & noteworthy global earthquakes, SCEC, 2004.
- Kilb, D., V. Martynov, F.L. Vernon, Spatial/Temporal interdependence of aftershocks following the 10/31/2001 M5.1 Anza Earthquake, AGU 2004.
- Kilb, D., I. Cooper, R. de Groot, W. Schindle, R. Mellors, M. Benthien, Using 3d Interactive Visualizations In Teacher Workshops, AGU, 2004.
- Martynov, V., F.L. Vernon, D. Kilb, Seismic Attenuation Anisotropy in the Crust Beneath ANZA (Southern California), AGU, 2004.
- Nayak, A., F.L. Vernon, G. M. Kent, J. Orcutt, D. Kilb, R. Newman, L. Smarr, T. DeFanti, J. Leigh, L. Renambot, A. Johnson. High-resolution visualization of USArray data on a 50 megapixel display using OptIPuter technologies, AGU, 2004.
- Biasi, G., D. Kilb, J. G. Anderson, J. Brune, Progress in Kappa Estimation at Yucca Mountain, AGU 2004.
- Anderson, J. G., G. Biasi, J. N. Brune, M. D. Purvance, D. Kilb, Evidence for Variability in the Shape, not Just the Level, in the High Frequency Spectrum of Strong Ground Motions, AGU, 2004.
- Kane, D.L., D. Kilb, A. Berg and V. Martynov, Quantifying The Remote Triggering Capabilities Of Large Teleseismic Earthquakes Using 22 Years Of Data From The Anza Seismic Network Catalog (Southern California), SSA, April 2005.
- Kilb, D., J. Bowen, C. Cruz, J. Eakins, K. Lindquist, V. G. Martynov, A. Nayak, R.L. Newman, J. Otero, G. Prieto and F.L. Vernon, Near-Real Time Generation Of 3d Interactive Visualization And Web-Based Information Pertaining To The September 28, 2004 Mw 6 Parkfield Earthquake, SSA, April 2005.
- Nayak, A., F. Vernon, G. Kent, J. Orcutt, D. Kilb, R.L. Newman, J. Eakins, L. Smarr, T. DeFanti, J. Leigh, L. Renambot, A. Johnson, iCluster : Visualizing USArray data on a scalable high resolution tiled display using the OptIPuter, GEON meeting, May 2005.
Links
- 2005-06-12 Mw 5.2 quake near Anza, CA
- 2001-10-31 Mw 5.1 quake near Anza, CA
- USGS page for June 12th, 2005 Mw 5.2 quake near Anza, CA
- Learn more about the ANZA deployment
- Visual object (3-D interactive models) library
Learn more about the Anza group (including who works
here, other networks, nuclear tests in China/India/Pakistan).
Learn
more about the ANZA network
(includes more station information, research, etc).