Chapter 3: Initial results from the Anza data: Figures
Figure 1
Ray paths for P and S waves through the one dimensional velocity model (Table 1) for the ANZA network generated by a joint hypocenter-velocity structure inversion program. Seismic sources were placed at 2.5, 5, 10, and 20 km depth in the model. At each depth the same take-off angles from the source were used for P and S waves.
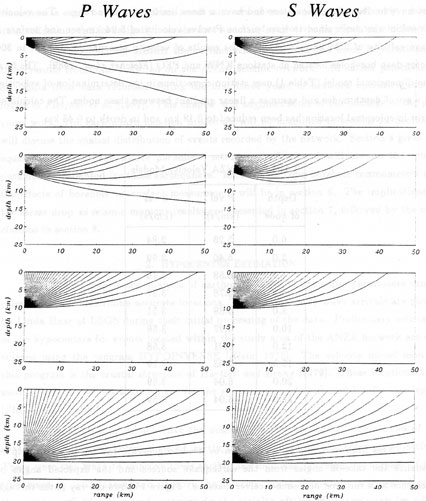
Figure 2
Seismicity recorded on the ANZA network in map view and cross-sections. Four clusters of seismicity are identified: Anza (AN), Cahuilla (CA), Hot Springs (HS), and Table Mountain (TM). All depths are referenced to the top of the Toro Peak (elevation 2657 m). ANZA network stations are identified by the solid triangles.
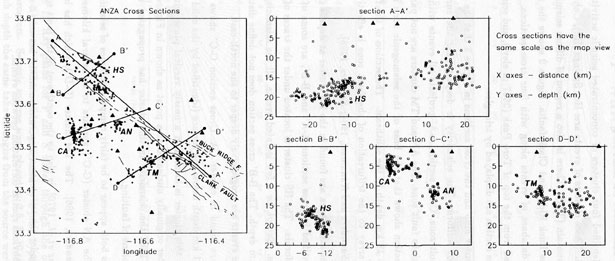
Figure 3
Cumulative number of magnitude ML >= 2.0 events from the four clusters between 1975 and 1989. The seismicity from the Buck Ridge region has been merged with the TM cluster. The data is from the southern California seismic network.
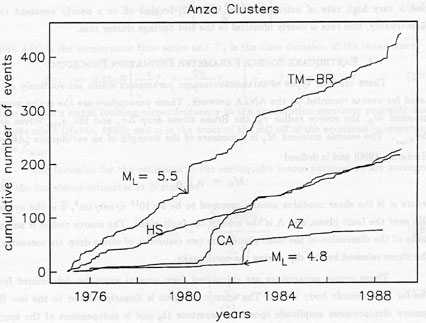
Figure 4
Comparison of the source moment and radius estimates calculated from P and S waves for the ANZA dataset. Only parameters determined with a minimum of six stations of data are shown. Dashed lines mark the ratios between the P and S wave values of 2 for source radius and 3 for scalar seismic moment.
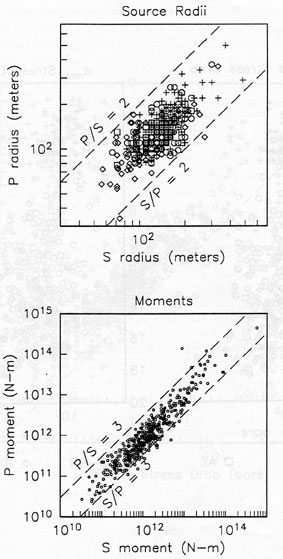
Figure 5
Stress drop vs depth plots for the Brune and arms methods. The clusters from Figure 2 are marked by a different symbol. The values of stress drop tend to increase with depth.
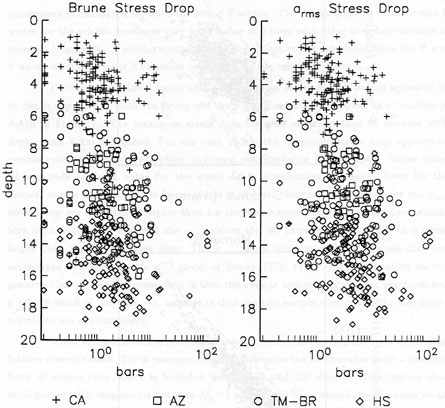
Figure 6
Comparison of the arms and Brune stress drop estimates. The arms estimator gives larger values by a factor of 2 to 3 on average. The symbols designate the same clusters as is Figure 5.
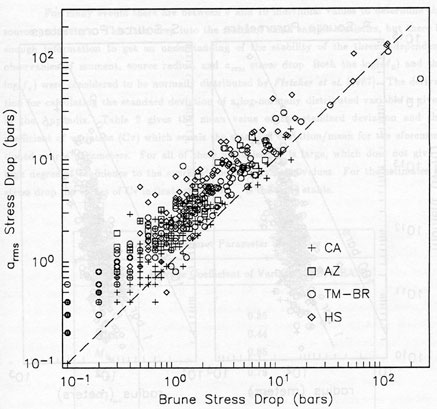
Figure 7
Seismic moment vs source radius data for P and S waves. The solid lines mark values of constant stress drop. There appears to be a minimum bound for the size of about 50 meters for the source radius estimates from the ANZA network data.
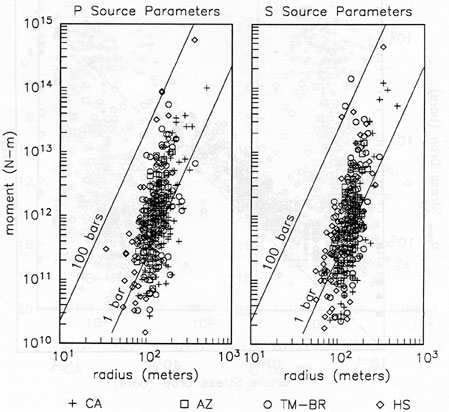
Figure 8
Displacement amplitude spectra for the P wave of a local earthquake measured at the KNW borehole site. Spectra from surface sensors and from borehole seismometers at 150 and 300 meter depth are displayed. The spectra from the surface measurements show large amplifications in the frequency band of 10 to 40 Hz as well as strong attenuation above 60 Hz when compared to the spectra from the boreholes.
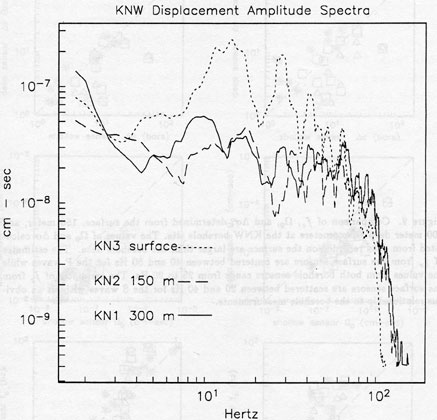
Figure 9
Comparison of fc , Ω0, and δ σ , determined from the surface, 150 meter, and 300 meter deep seismometers at the KNW borehole site. The values of Ω0 and δ σ calculated from data recorded on the surface are larger than the borehole data. The estimates of fc from the surface sensors are centered between 40 and 50 Hz for the P waves while the values from both borehole sensors range from 25 to 90 Hz. The estimates of fc from the surface sensors are scattered between 20 and 40 Hz for the S waves without an obvious relationship to the borehole measurements.
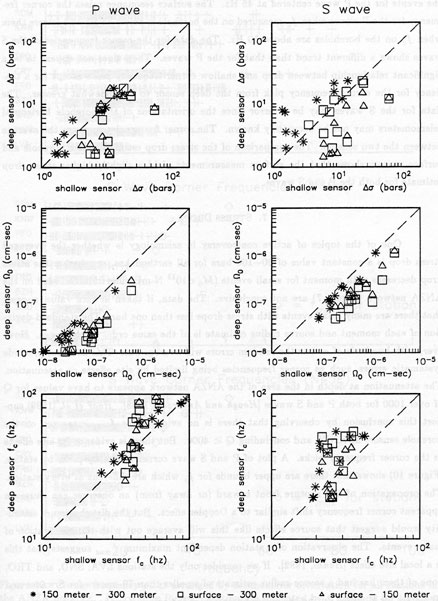
Figure 10
Corner frequency picks arranged by seismometer orientation for all stations in the ANZA network. fmax values for each station are indicated by a diamond for the horizontal components.
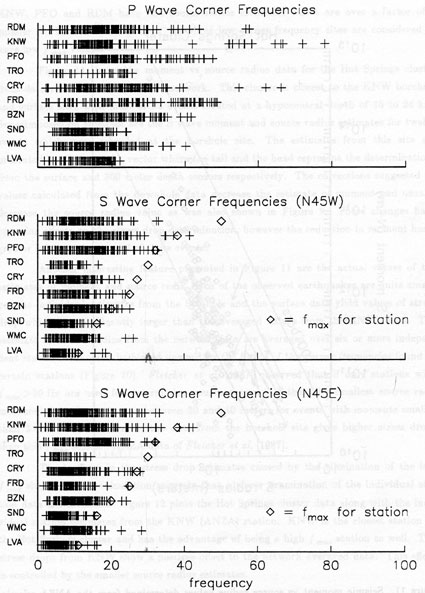
Figure 11
Seismic moment vs source radius values determined from the ANZA seismic network which are averages from six or more station estimates. The arrows indicate the correction to the surface measurements by using the data from the 300 meter deep seismometers at KNW.
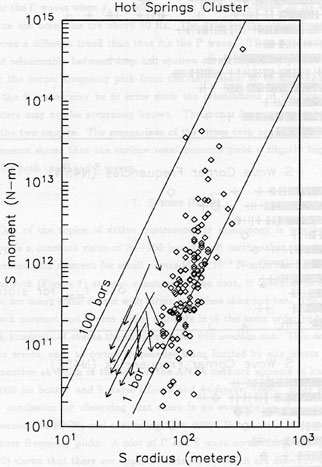
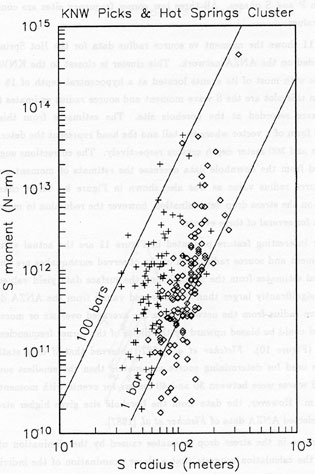
Figure 12
Seismic moment vs source radius values determined from the ANZA seismic network which are averages from six or more station estimates. Crosses identify the individual KNW station source parameter estimates.