Chapter 1: Seismicity of the San Jacinto Fault Zone: Figures
Figure 1
Fault map of southern California with the individual strands of the San Jacinto fault zone identified. The heavy dashed lines mark the limits of the surface outcrops of the Peninsular Ranges batholith.
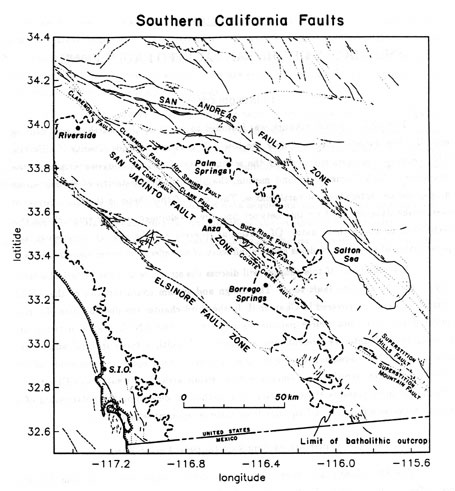
Figure 2
Rupture areas of historical earthquakes and the existing seismic slip gaps along the San Jacinto fault zone. Rupture areas enclosed with a dashed line are not well constrained.
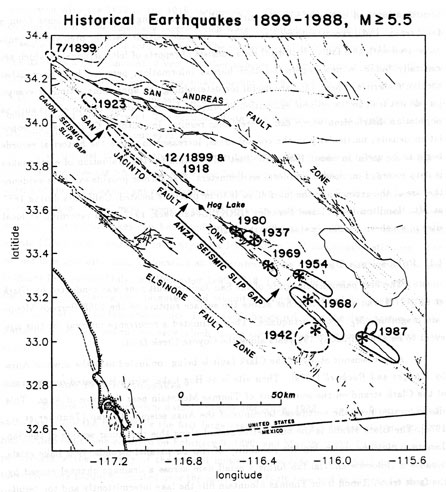
Figure 3
Fault segments on the San Jacinto fault zone defined by WGCEP [1988]. Percentages are the estimates of the probability of whether the segment filling earthquake will occur in the next 30 years.
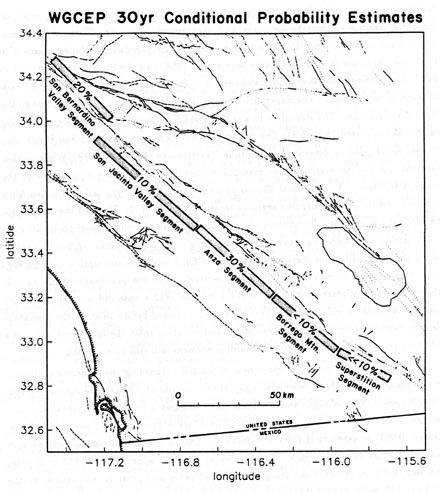
Figure 4
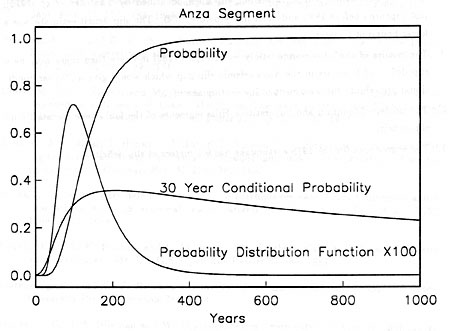
The probability, probability density function, and 30 year conditional probability for the segment filling earthquake in the Anza-Coyote Mountain segment measured in years from the previous earthquake.