Chapter 2: Anza Seismic Network: Description: Figures
Figure 1
All ML (Quality A and B) located since the upgrade of the southern California seismic network in 1975 are shown on the left with the Anza gap [Sanders and Kanamori, 1984] and the Anza seismic slip gap of Thatcher et al. [1975]. The expanded view gives the locations of the ANZA network stations (filled triangles), the USGS strong motion accelerograph network (open squares), and the epicenters of all ML > 4.0 earthquakes and their magnitudes since 1975.
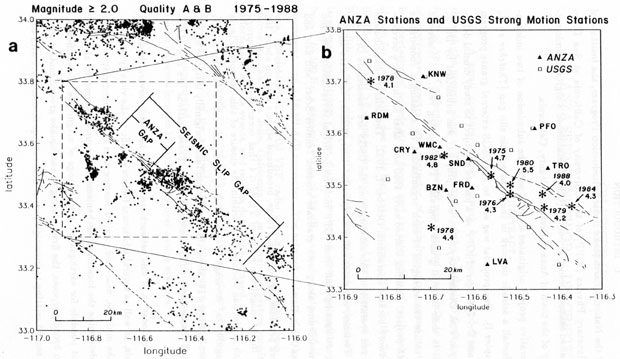
Figure 2
Geological map of the Anza area copied from the 1:250,000 scale geological map of California, Santa Ana sheet. ANZA network stations are identified by solid blue circles.
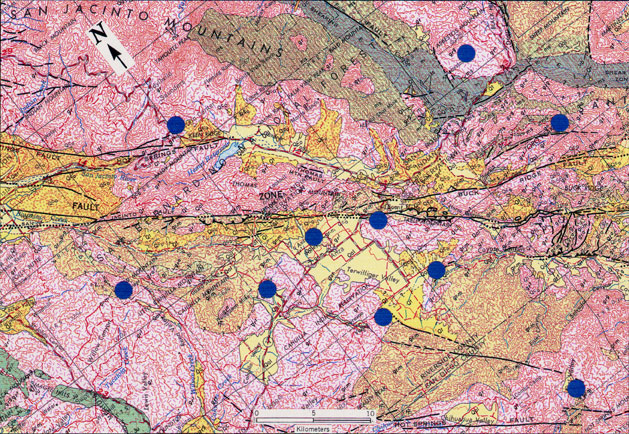
Figure 3
Map and schematic diagram of the ANZA telemetry network. Remote stations are identified by the open triangles and transmit data via VHF links (short dashed lines) to Toro Peak. The data is multiplexed on Toro and send by microwave (dashed line) telemetry to Soledad Mt. where it is relayed to IGPP.
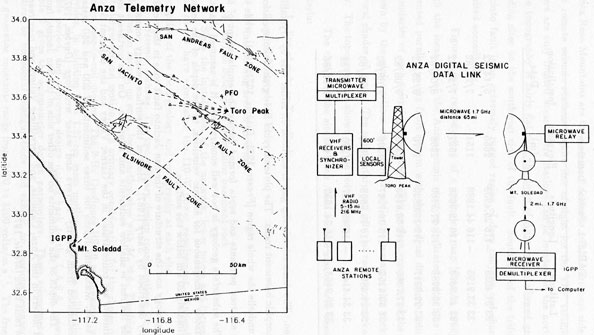
Figure 4
Block diagram of the functional elements at a remote field station.
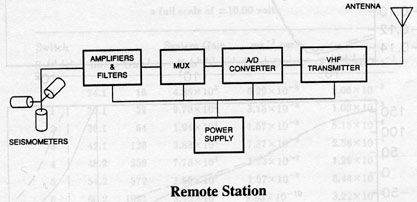
Figure 5
Analog system response for the ANZA remote field station given in group delay, phase, and amplitude. Solid and dashed lines identify response using 62.5 and 100 Hz anti-alias filters respectively.
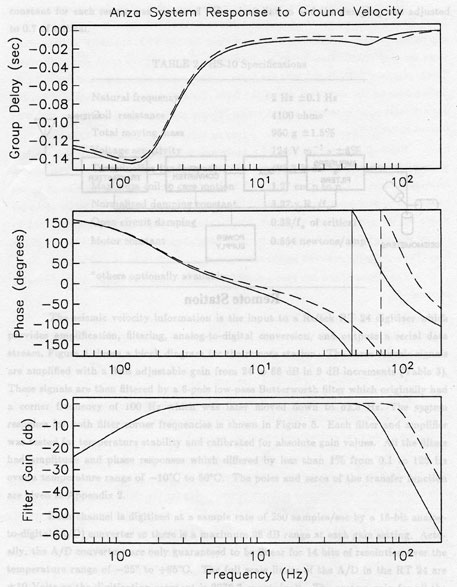
Figure 6
Block diagram of the functional elements at the Toro Peak relay station.
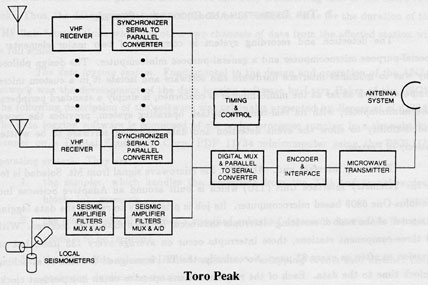
Figure 7
Power spectrum, phase, and coherence of ground noise measured on two vertical seismometers located at PFO.
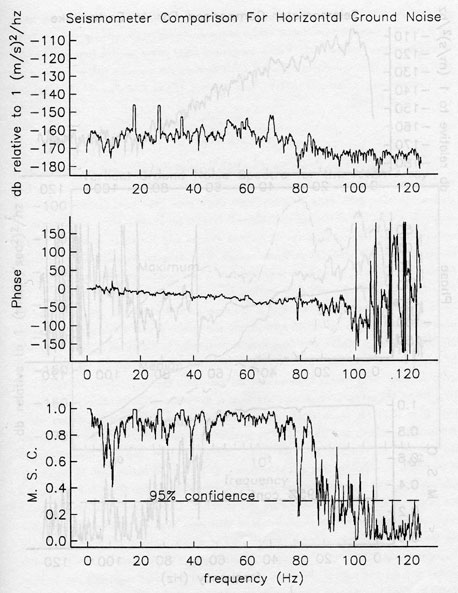
Figure 8
Power spectrum, phase, and coherence of local earthquake measured on two vertical seismometers located at PFO.
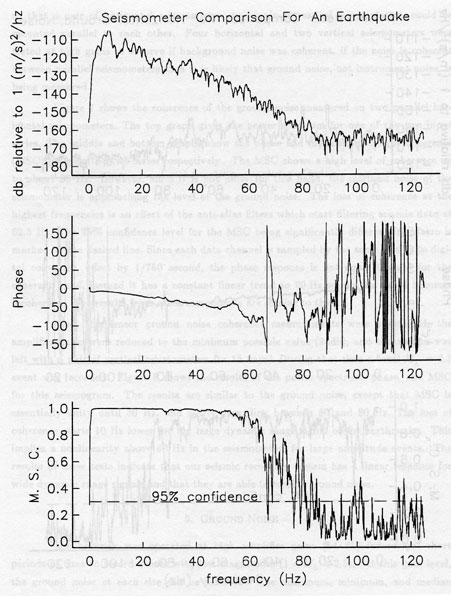
Figure 9
Maximum, median, and minimum vertical acceleration ground noise spectra using data from all ANZA stations during a measurement in July, 1984.
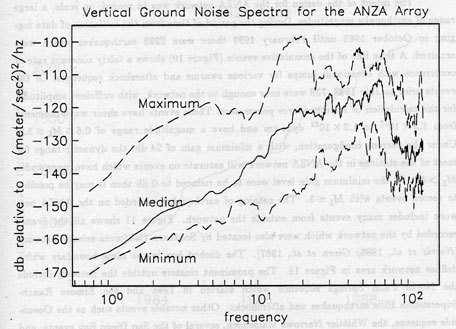
Figure 10
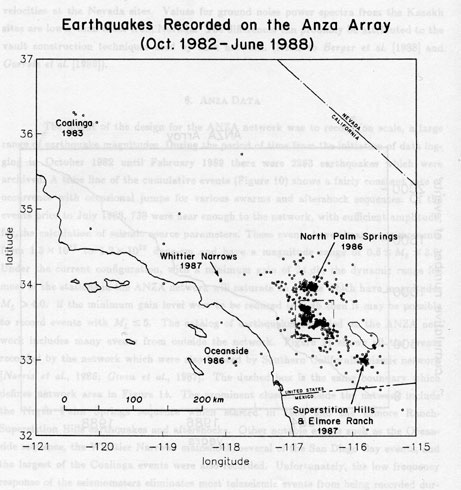
Cumulative number of events recorded on the ANZA network as a function of time.
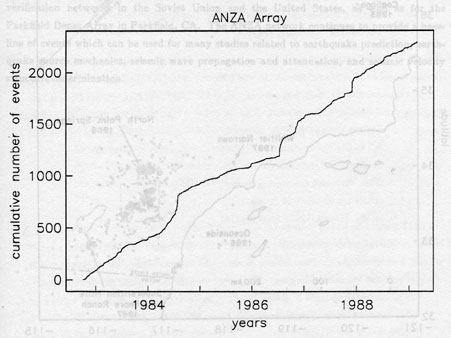
Figure 11
Epicenters of earthquakes recorded by the ANZA seismic network.