Chapter 6: Frequency Dependent Polarization Analysis of High-frequency Seismograms: Figures
Figure 1
Diagram to illustrate the definitions of the polarization angles ΘH and ΘV. The azimuth ΘH is restricted to [-180, 180] and is measured counterclockwise from e(hat)2. The angle ΘH is chosen by determining the maximum horizontal displacement of the particle motion for which ΘV will fall in the range 0 ≤ ΘV ≤ 90. The ellipticity of the particle motion is defined by the amplitudes | z1 |, | z2 |, | z3 | and the phase angles φHH and φVH (defined in text).
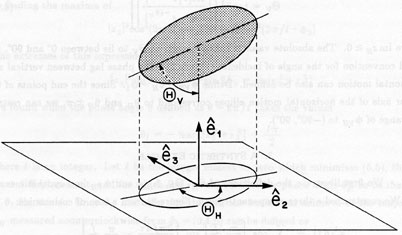
Figure 2
Polarization test series.
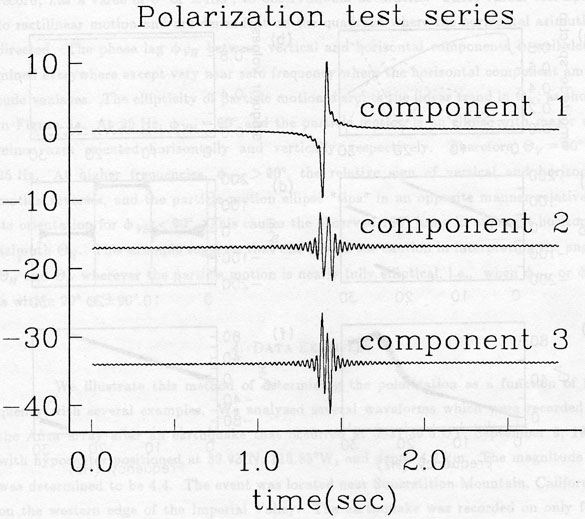
Figure 3
a. Amplitude spectra and polarization angles calculated from the test series. Spectra for components 1 (solid line), 2 (coarse dashed line), and 3 (fine dashed line).
b. The singular value associated with principal polarization is plotted against frequency (solid line), and the secondary singular values (dashed lines).
c. Horizontal azimuth of particle motion.
d. Phase angle defined by the major and minor axis of the horizontal particle motion ellipse.
e. Angle of incidence of particle motion measured from nadir.
f. Phase angle defined by major and minor axis of the vertical particle motion ellipse.
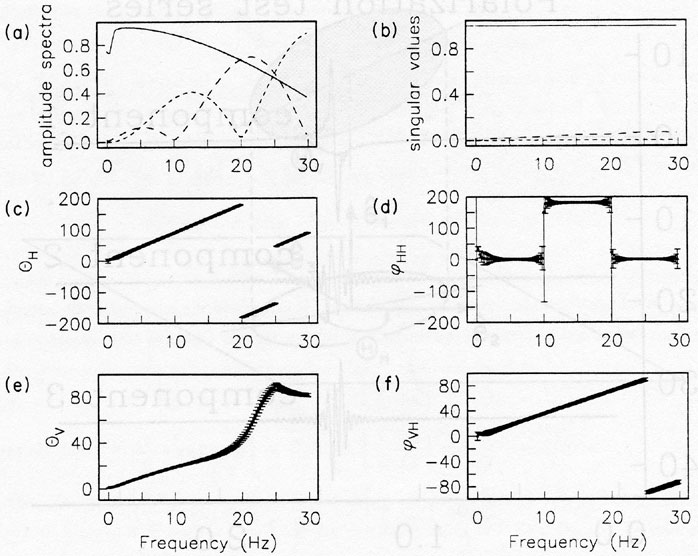
Figure 4
Anza data used in polarization example. Range in kilometers and expected ΘH are given in right-hand columns. Maximum amplitude in counts is given in left-hand column, along with station code and component number.
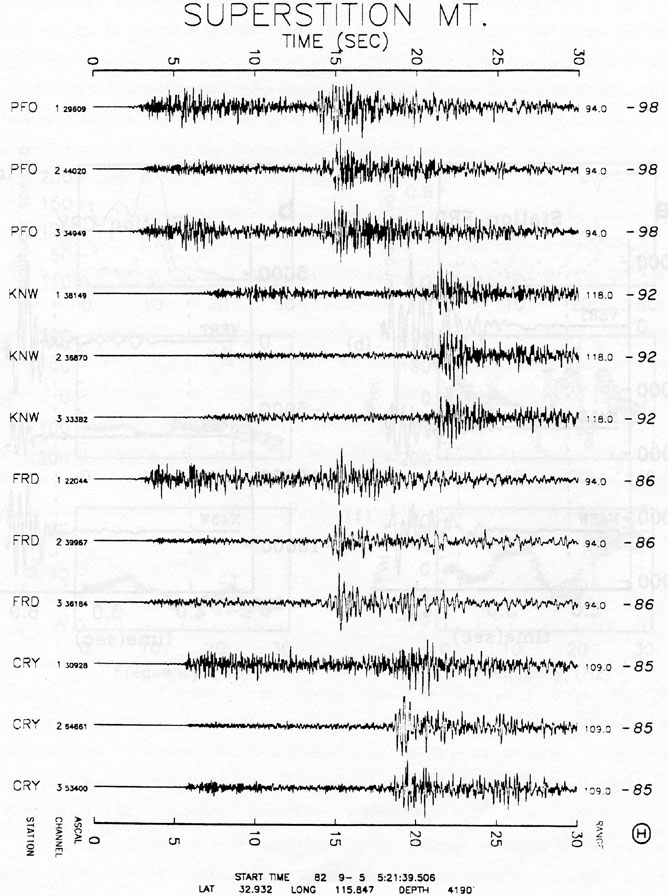
Figure 5
a. Plots of precursory waveform observed on station FRD.
b. Plots of precursory waveform observed on station CRY. The portion used for spectrum analysis is bounded by dashed lines. Both horizontal components at station FRD exhibit visible 60-Hz power line noise. The spectral leakage resistance of the 4 π prolate eigentapers used in the analysis guards against bias in the frequency band of interest.
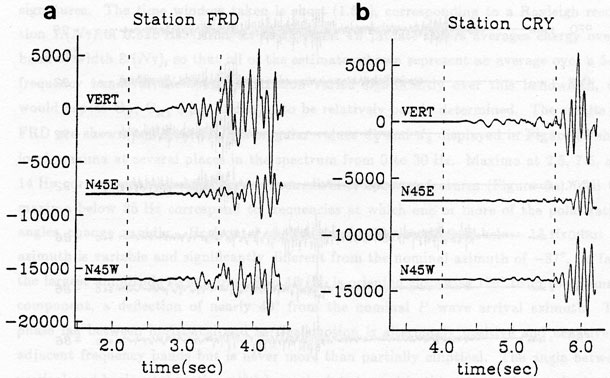
Figure 6
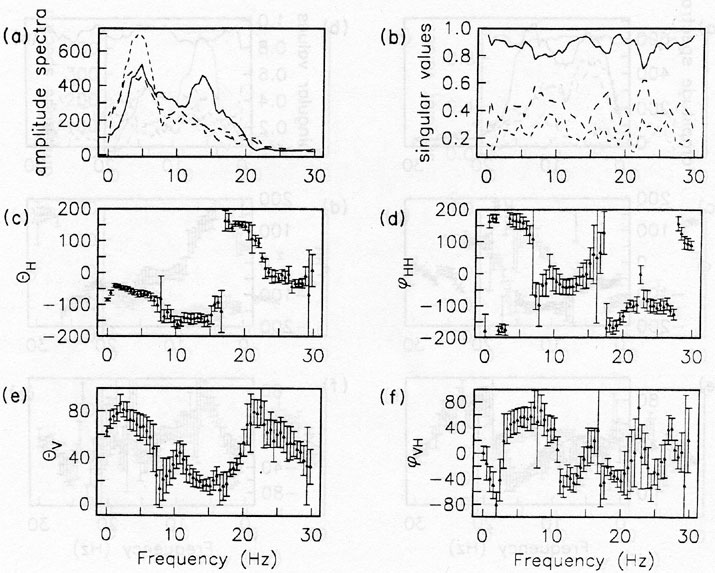
Amplitude spectra and polarization angles for precursory waveform observed at station FRD. Solid/dashed line conventions are identical to those of Figure 3.
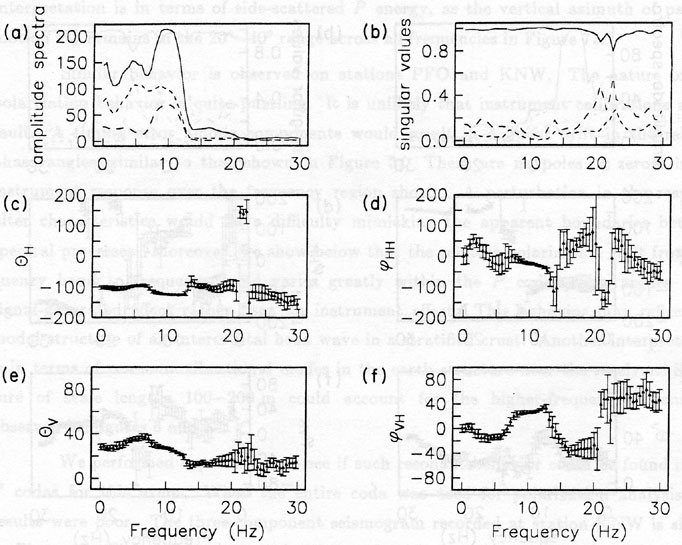
Figure 7
Amplitude spectra and polarization angles for precursory waveform observed at station CRY. Solid/dashed line conventions are identical to those of Figure 3.
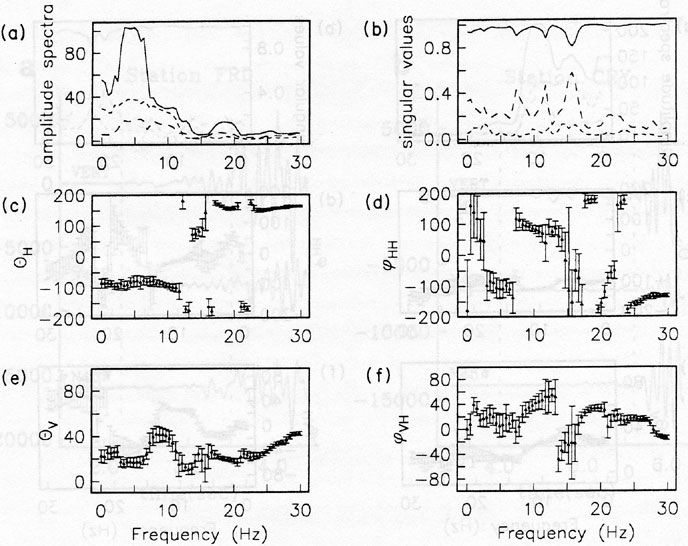
Figure 8
Three-component seismogram for Superstition Mountain event observed at Anza station KNW. The 14-s segment chosen for polarization analysis is within the dashed lines.
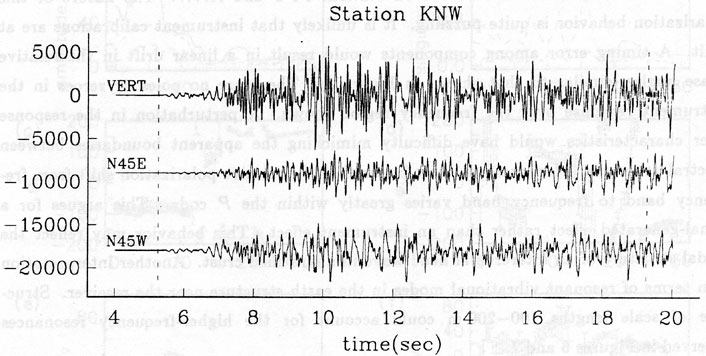
Figure 9
Amplitude spectra and polarization angles for the 14-s P coda segment shown in Figure 8. Solid/dashed line conventions are identical to those of Figure 3.
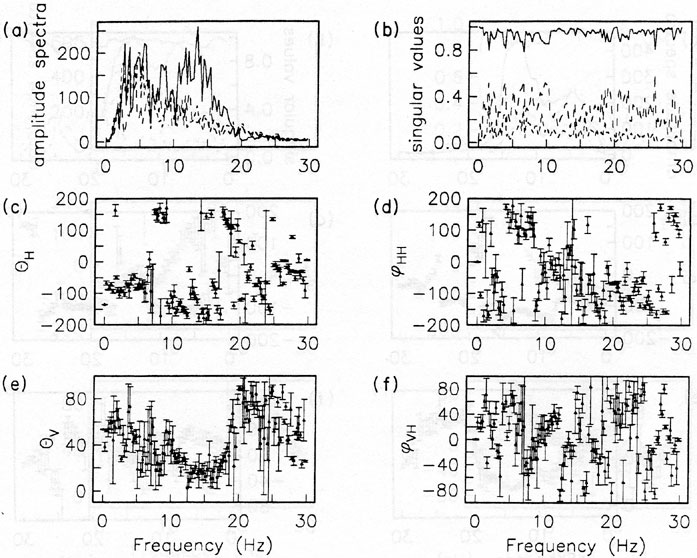
Figure 10
Amplitude spectra and polarizaton angles for the first 2 s of the 14-s P coda segment shown in Figure 8. Solid/dashed line conventions are identical to those of Figure 3.
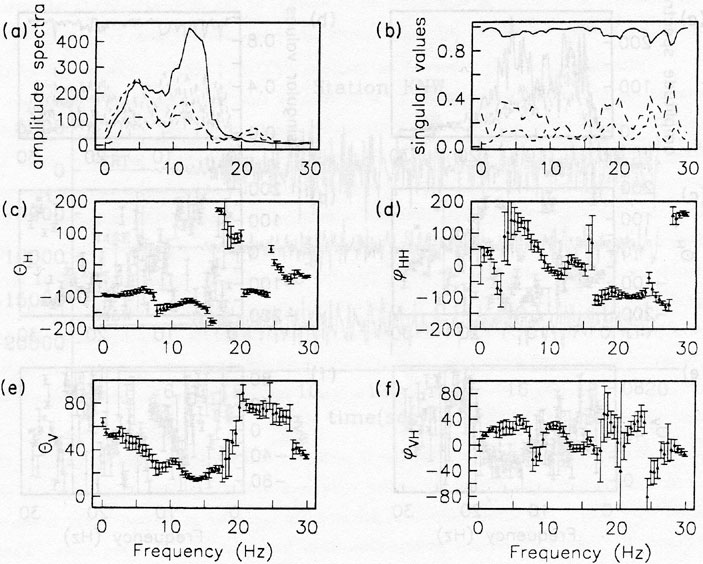
Figure 11
Amplitude spectra and polarization angles for the seventh and eighth seconds of the 14-s P coda segment shown in Figure 8. Solid/dashed line conventions are identical to those of Figure 3.
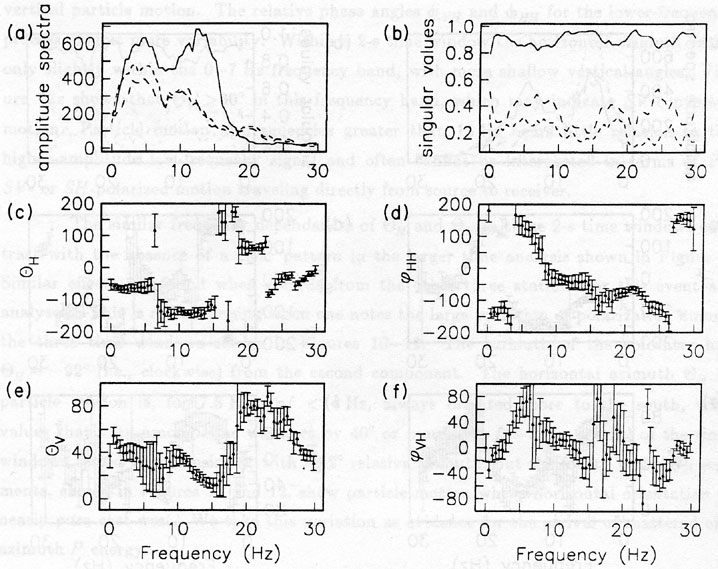
Figure 12.
Amplitude spectra and polarization angles for the eleventh and twelfth seconds of the 14-s P coda segment shown in Figure 8. Solid/dashed line conventions are identical to those of Figure 3.